Background Information
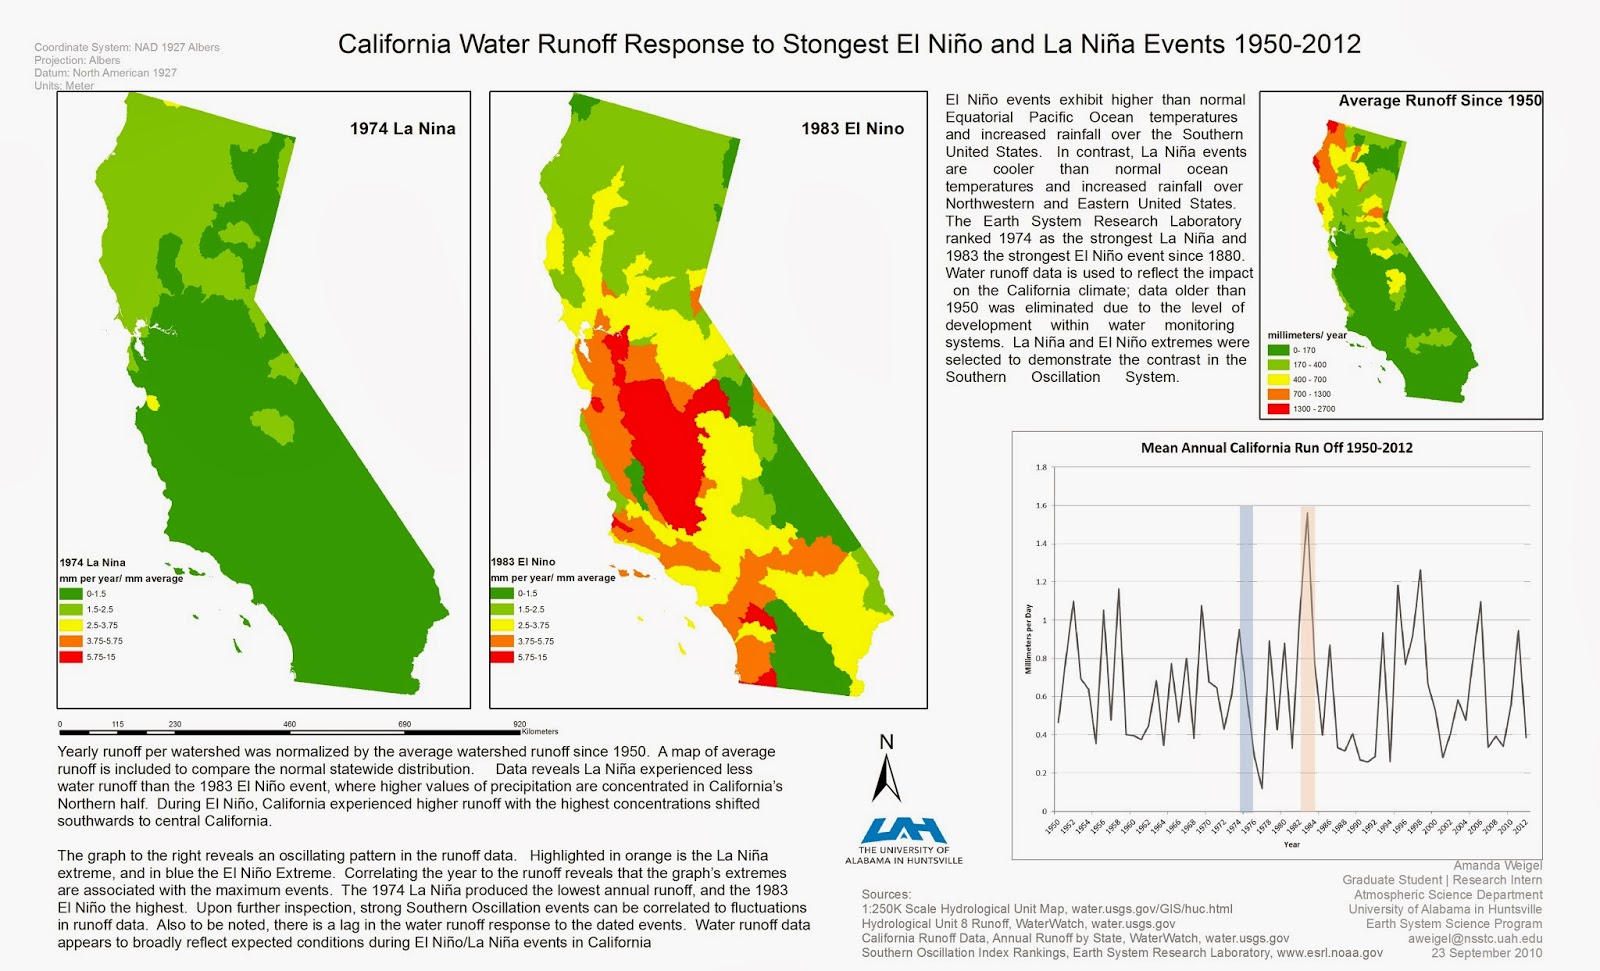
El Nino events exhibit higher than normal Equatorial Pacific Ocean temperatures and increased rainfall over the Southern United States. In contrast, La Nina events are cooler than normal ocean temperatures and increased rainfall over Northwestern and Eastern United States. The Earth System Research Laboratory ranked 1974 as the strongest La Nina and 1983 the strongest El Nino event since 1880. Water runoff data is used to reflect the impact on the California climate; data older than 1950 was eliminated due to the level of development within water monitoring systems. La Nina and El Nino extremes were selected to demonstrate the contrast in the Southern Oscillation System.
Data Sets
- State Boundaries: National Atlas
- 1:250,000 Hydrologic Units: USGS
- Hydrologic Unit Runoff: USGS
Methodology
Hydrologic Unit Runoff data was opened in Microsoft Excel, averaged to derive the mean annual run off from 1950-2012. Data was then trimmed down to the maximum La Nina year (1974), maximum El Nino year (1984), and average runoff. All data sets where then uploaded into ArcGIS 10.1 for analysis. The altered Excel file was joined to the Hydrologic Unit (HUC) shapefile The California state boundary was selected and exported into a separate shape file for mapping purposes. The projection was then set and equalized among all files. The joined HUC data as them clipped down to the spatial extent of California.
Yearly runoff per watershed was normalized by the average watershed runoff since 1950. A map of average runoff is included to compare the normal statewide distribution. Three maps were generated in this study, one of which plotting the mean annual runoff withing the state of California. To compare the run off distribution and intensity. Run off values measure during each of the ENSO year was normalized by the mean annual runoff for each HUC area.
Conclusions
Data revealed the La Nina event experienced less water runoff than the 1983 El Nino event, where higher values of precipitation are concentrated in California’s Northern half. During El Nino, California experienced higher runoff with the highest concentrations shifted southwards to central California.
Correlating the year to the runoff reveals that the graph’s extremes are associated with the maximum events. The 1974 La Nina produced the lowest annual runoff, and the 1983 El Nino the highest. Upon further inspection, strong Southern Oscillation events can be correlated to fluctuations in runoff data. Also to be noted, there is a lag in the water runoff response to the dated events. Water runoff data appears to broadly reflect expected conditions during El Nino/La Nina events in California
Map Links
No comments:
Post a Comment